Working from home gave me some more time to learn new things and also made me think about monitoring my home network. After searching what is available I’ve turned to Prometheus as a monitoring solution and Grafana for observability dashboards. I already own the latest Raspberry Pi so I’ve started building a VM in the VMware ESXi ARM host (the Raspberry Pi).
After that, I started thinking of playing/using another technology: Docker containers. So I’ve built a container for Prometheus and one for Grafana.
At this point, I was not monitoring anything except the Prometheus container itself. I’ve turned my attention to my home firewall/router/wifi. For this, I needed to use SNMP, and to do that with Prometheus you need an SNMP exporter. So I’ve turned again to Docker and I used a docker container. The role of the SNMP exporter is to do the SNMP polling and convert/map the data to a format Prometheus understands. You will need to provide it with a snmp.yml file that tells it what OIDs to use when polling.
Next, I wanted to monitor the Linux VMs I already had on the ESXi host. To do that it is much simpler. You only have to install a node exporter on each VM and point Prometheus to those. This will export hardware and OS metrics.
And last, why not monitor the Docker engine, as I wanted to be able to see what the containers were doing. For this, I’ve used another Docker container running Cadvisor. Cadvisor provides container users an understanding of the resource usage and performance characteristics of their running containers
In the end I was having 4 Docker containers, each with its own purpose.
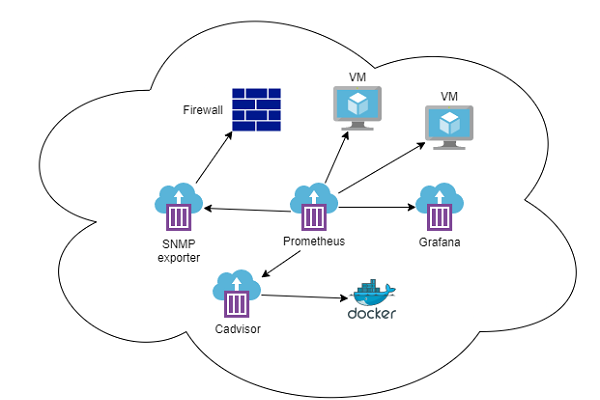
Next, I’ve had to tell Prometheus where to get the data. To do this you need to use the prometheus.yml file and point it to the node exporters, SNMP exporter and the cadvisor(docker exporter):
global:
scrape_interval: 10s
evaluation_interval: 10s
scrape_configs:
- job_name: 'snmp'
metrics_path: /snmp
params:
module: [mikrotik]
static_configs:
- targets:
- 192.168.1.1 # SNMP device - add your IPs here
relabel_configs:
- source_labels: [__address__]
target_label: __param_target
- source_labels: [__param_target]
target_label: instance
- target_label: __address__
replacement: 192.168.1.8:9116 # SNMP exporter.
- job_name: 'node_exporter_metrics'
scrape_interval: 10s
static_configs:
- targets: ['192.168.1.8:9100','192.168.1.9:9100']
- job_name: 'docker'
static_configs:
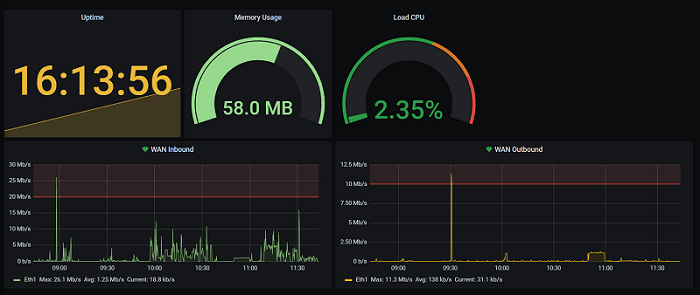
- targets: ['192.168.1.8:8080']After configuring the polling for the information part, I focused on what things I wanted to observe. For this, I’ve used Grafana and I’ve built a dashboard for my home network.
CPU/Memory/Uptime, WAN interface :
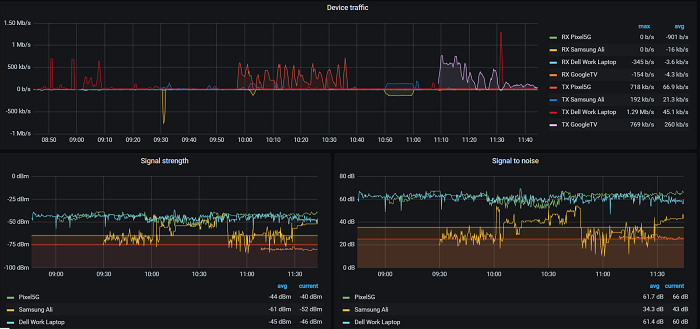
Wifi Traffic, Signal strenght , and Signal to noise ratio:
I’ve also set up some alerts for CPU and traffic and pointed them to a Slack Channel. This way I can be alerted if something happens. It is pretty easy to do this in Grafana.
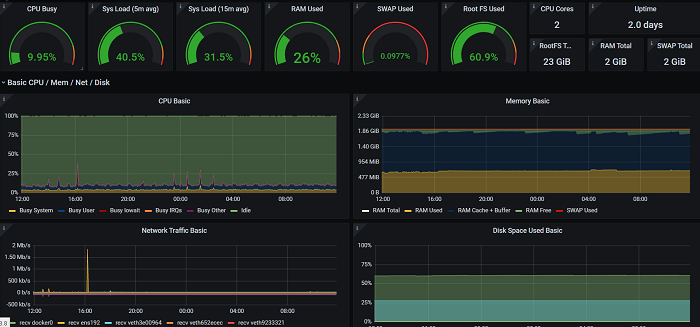
Next, I’ve found some nice Grafana Dashboards and I’ve used them to display my VM’s info :
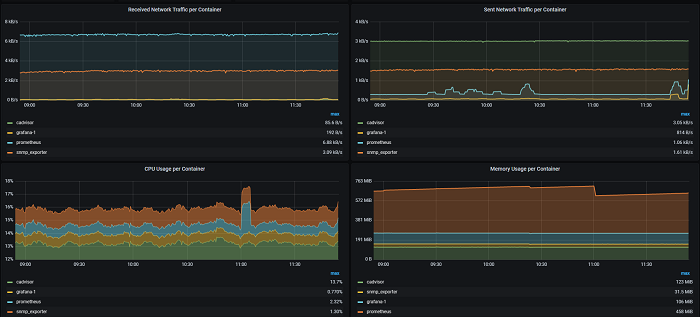
and Docker info for containers:
And that was it. It was a really nice and fun home project.
You can find some information about the things I’ve used here:
Grafana in a docker container: https://grafana.com/docs/grafana/latest/installation/docker/
Prometheus SNMP exporter: https://github.com/prometheus/snmp_exporter
SNMP monitoring with Prometheus: https://medium.com/@openmohan/snmp-monitoring-and-easing-it-with-prometheus-b157c0a42c0c
Cadvisor in a Docker: https://github.com/ZCube/cadvisor-docker
Node exporters: https://github.com/prometheus/node_exporter/releases/tag/v1.1.2
Prometheus in a Docker: https://prometheus.io/docs/prometheus/latest/installation/