I’ve bought a Raspberry Pi 4 (8GB RAM) for my home lab and used VMware ESXi for ARM so I can build some VMs on it. ESXi host on a small computer like this is pretty hard to believe. Usually, when you speak of ESXi you think of big servers. But having this little computer hosting some VMs is really a cheap solution for your home lab. And it is working.
There are many tutorials on how to install it, I’ve used this one:
https://www.raspberrypi.org/blog/get-vmware-on-raspberry-pi/
Being so small and having to host some VMs, has made me think about how to monitor the temperature of this little thing. It seems there is nothing by default to monitor it so I’ve googled it. And this is one of the articles I’ve found:
https://blogs.vmware.com/arm/2020/11/17/get-your-raspberry-pis-temperature-and-more/
There are 2 links in there, to projects that send the temperature to Graphite and to InfluxDB, but I wanted to log the temperature to a cloud-centralized log management software like LogDNA. So I’ve started my little project using the same python utility to get the temperature but log it to /var/log/syslog. I’ve used a bash script to do this:
monPath="/scratch/downloads/thpimon-main/pyUtil/pimon_util.py"
mon_output=$(python $monPath)
arm_rpi_boardtemp=$(echo $mon_output | awk -F'Temp:' '{print $2}'  | awk '{print $1}')

#log to a custom file
#FILE="/scratch/log/temp.log"
#echo  "`date '+%Y-%m-%d %H:%M:%S'` temp: $arm_rpi_boardtemp" >> $FILE

#log to syslog
logger "PiTemp: $arm_rpi_boardtemp"
I’ve added this script to a cron job so it runs every 5 min :
/var/spool/cron/crontabs/root
Next, I needed to allow Syslog messages to be sent through the firewall. For this I needed to create the services in an XML file :
<ConfigRoot>
<service>
<id>logdna</id>
<rule id='0000'>
<direction>outbound</direction>
<protocol>udp</protocol>
<porttype>dst</porttype>
<port>12345</port>
</rule>
<rule id='0001'>
<direction>outbound</direction>
<protocol>tcp</protocol>
<porttype>dst</porttype>
<port>12345</port>
</rule>
<enabled>true</enabled>
<required>false</required>
</service>
</ConfigRoot>
and then copy the file to the firewall folder and activate the new config using another bash script:
# set logging
esxcli system syslog config set --loghost='syslog-server.com:12345'
esxcli system syslog reload

# set firewall
cp temp.xml /etc/vmware/firewall/
esxcli network firewall refresh
esxcli network firewall unload
esxcli network firewall load
In the same script, I’ve configured where the Syslog messages are to be sent.(The Syslog server and port are only example)
And that was all I had to do on the VMware ESXi host. The only issue is that when you reboot it you lose the firewall part and the cron job you have added. That’s why it is a good idea to place these files on /scratch/downloads folder and then you can run the firewall script and add the cron job after a reboot.
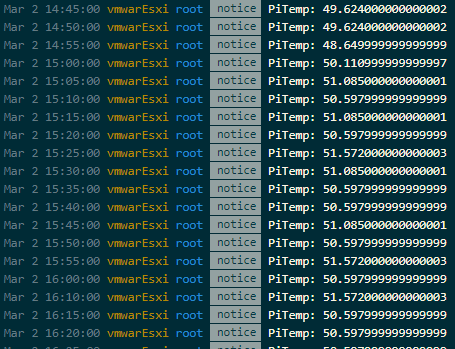
In the LogDNA console, this is how the logs look:
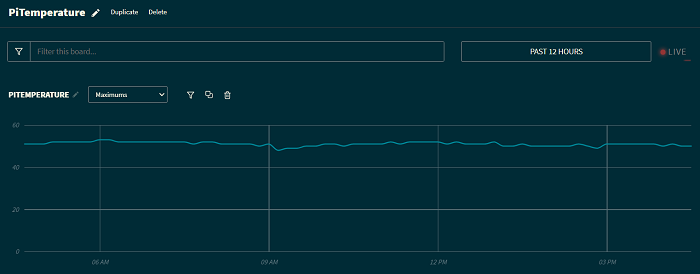
You can then use the parser to convert the temperature to a number and capture it in a field. And then you can use that field to build some nice boards like this one:
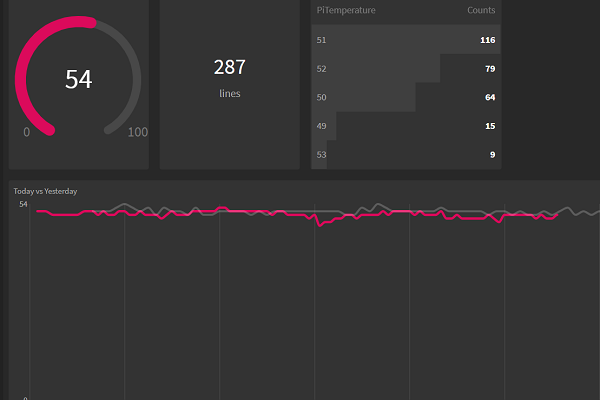
and Screens like this:
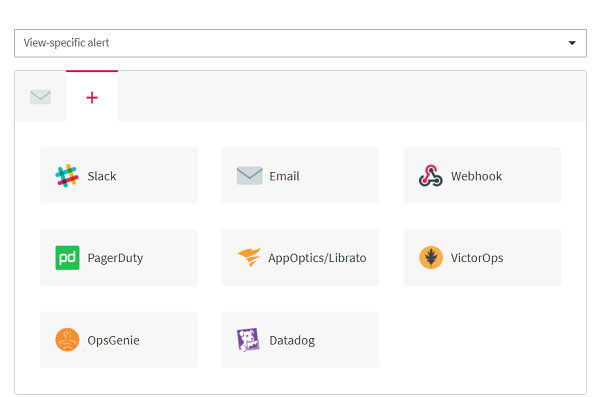
You can also set up an alert when it reaches a certain value (example 70 C) and sent it as an email or to a PagerDuty, Opsgenie, Slack, etc, or to a webhook.
Now I can be relaxed that if my Raspberry Pi will be overused I’ll be notified.
You can find the ESXi scripts here:
https://github.com/czirakim/VMware.ESXi.ARM.temperature.logging